
Azure Network Monitoring with Connection Monitor & Bicep !
In this article, I present how to set up network monitoring with the Connection Monitor tool (part of Azure Network Watcher) using Azure Bicep 🚀
If you want to practice with a lab directly, click here.
Overview
When talking about network monitoring in Azure, there are two important services to keep in mind:
-
Azure Monitor Network Insights - provides a comprehensive view of health and metrics for all deployed network resources, without requiring any configuration.
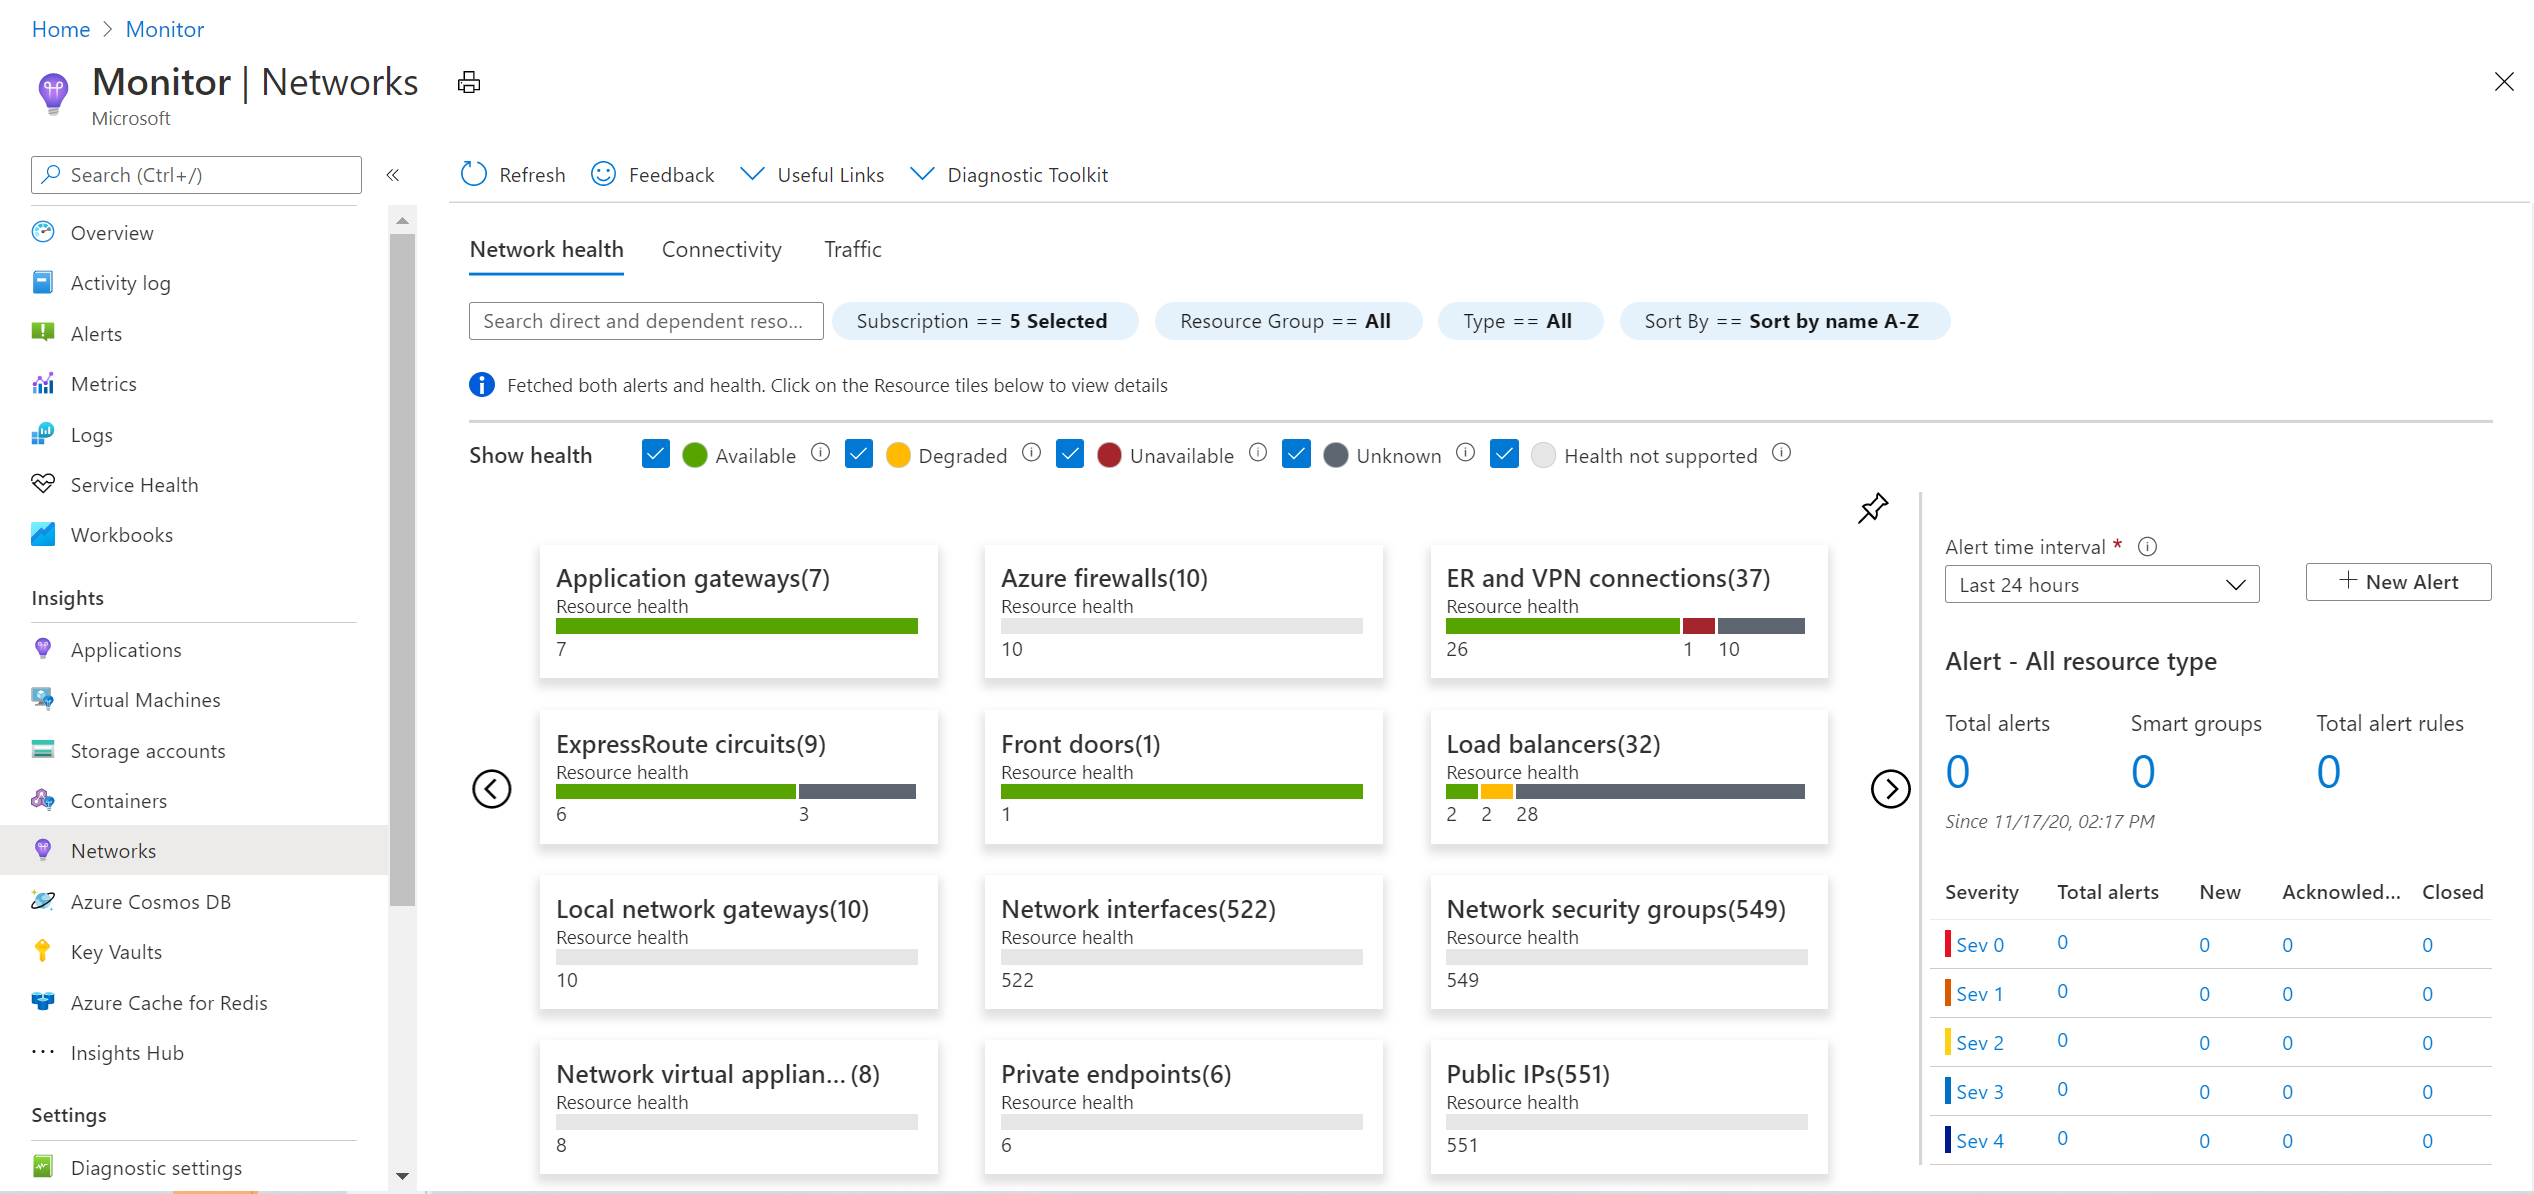
This tool is mainly used to get insights around network services status and provides an easy way to visualize the inventory of Azure networking resources.
- Azure Network Watcher - provides tools to monitor, diagnose, view metrics, and enable or disable logs for resources in an Azure virtual network. Below all available tools:
- IP Flow Verify - tests the communication between a source and destination IPv4 address, port, protocol (TCP or UDP) and informs you if the connection succeeds or fails.
- Next Hop - tests the communication between a source and destination IPv4 address and informs you what type of next hop is used to route the traffic.
- Effective Security Rules - shows all security rules applied to the network interface, the subnet the network interface is in, and the aggregate of both.
- VPN Troubleshoot - diagnoses the health of the gateway, or gateway connection, and informs you whether a gateway and gateway connections are available. If the gateway or connection is not available, VPN diagnostics tells you why, so you can resolve the problem.
- Connection Troubleshoot - tests a connection between a VM and another VM, an FQDN, a URI, or an IPv4 address at a point in time, rather than monitoring it over time, as connection monitor does.
- Packet Capture - creates packet capture sessions to track traffic to and from a virtual machine.
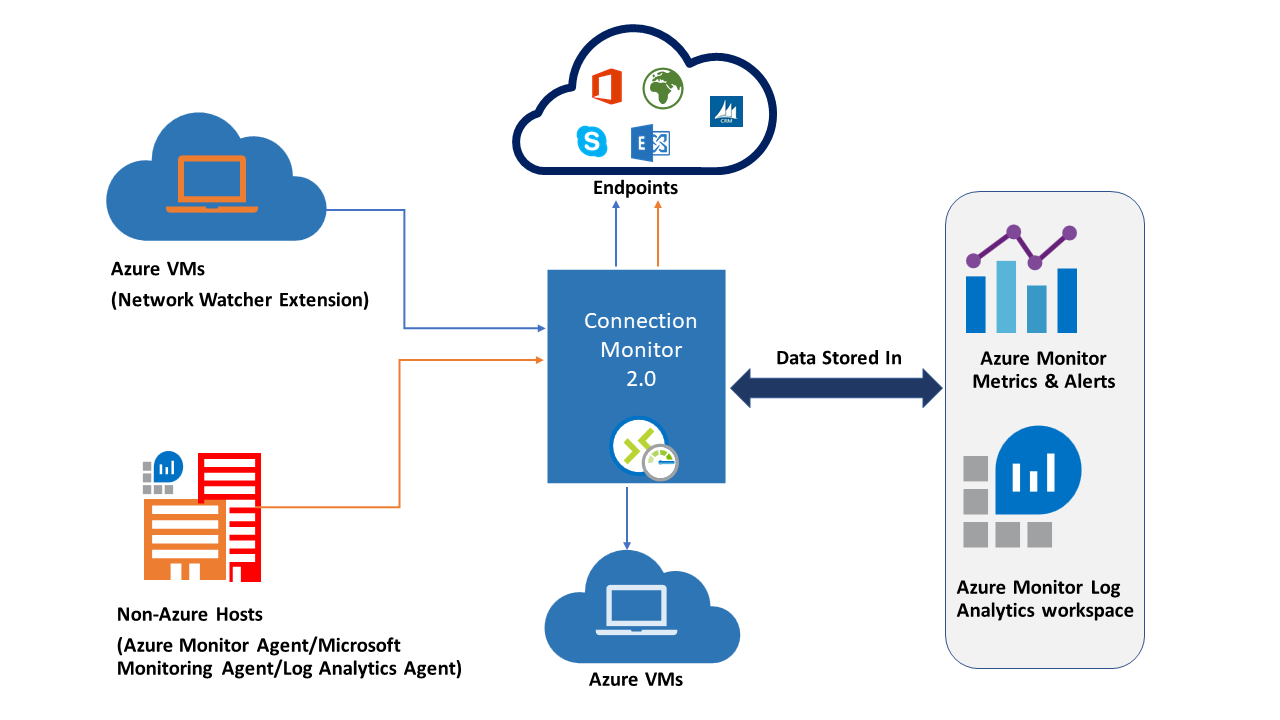
Connection Monitor Overview
Long story short: Connection Monitor tool is used to monitor a network flow between a source (Azure VMs or on-premises machines that have an installed monitoring agent) and a destination (Microsoft 365 URLs, Dynamics 365 URLs, custom URLs, Azure VM resource IDs, IPv4, IPv6, FQDN, or any domain name):
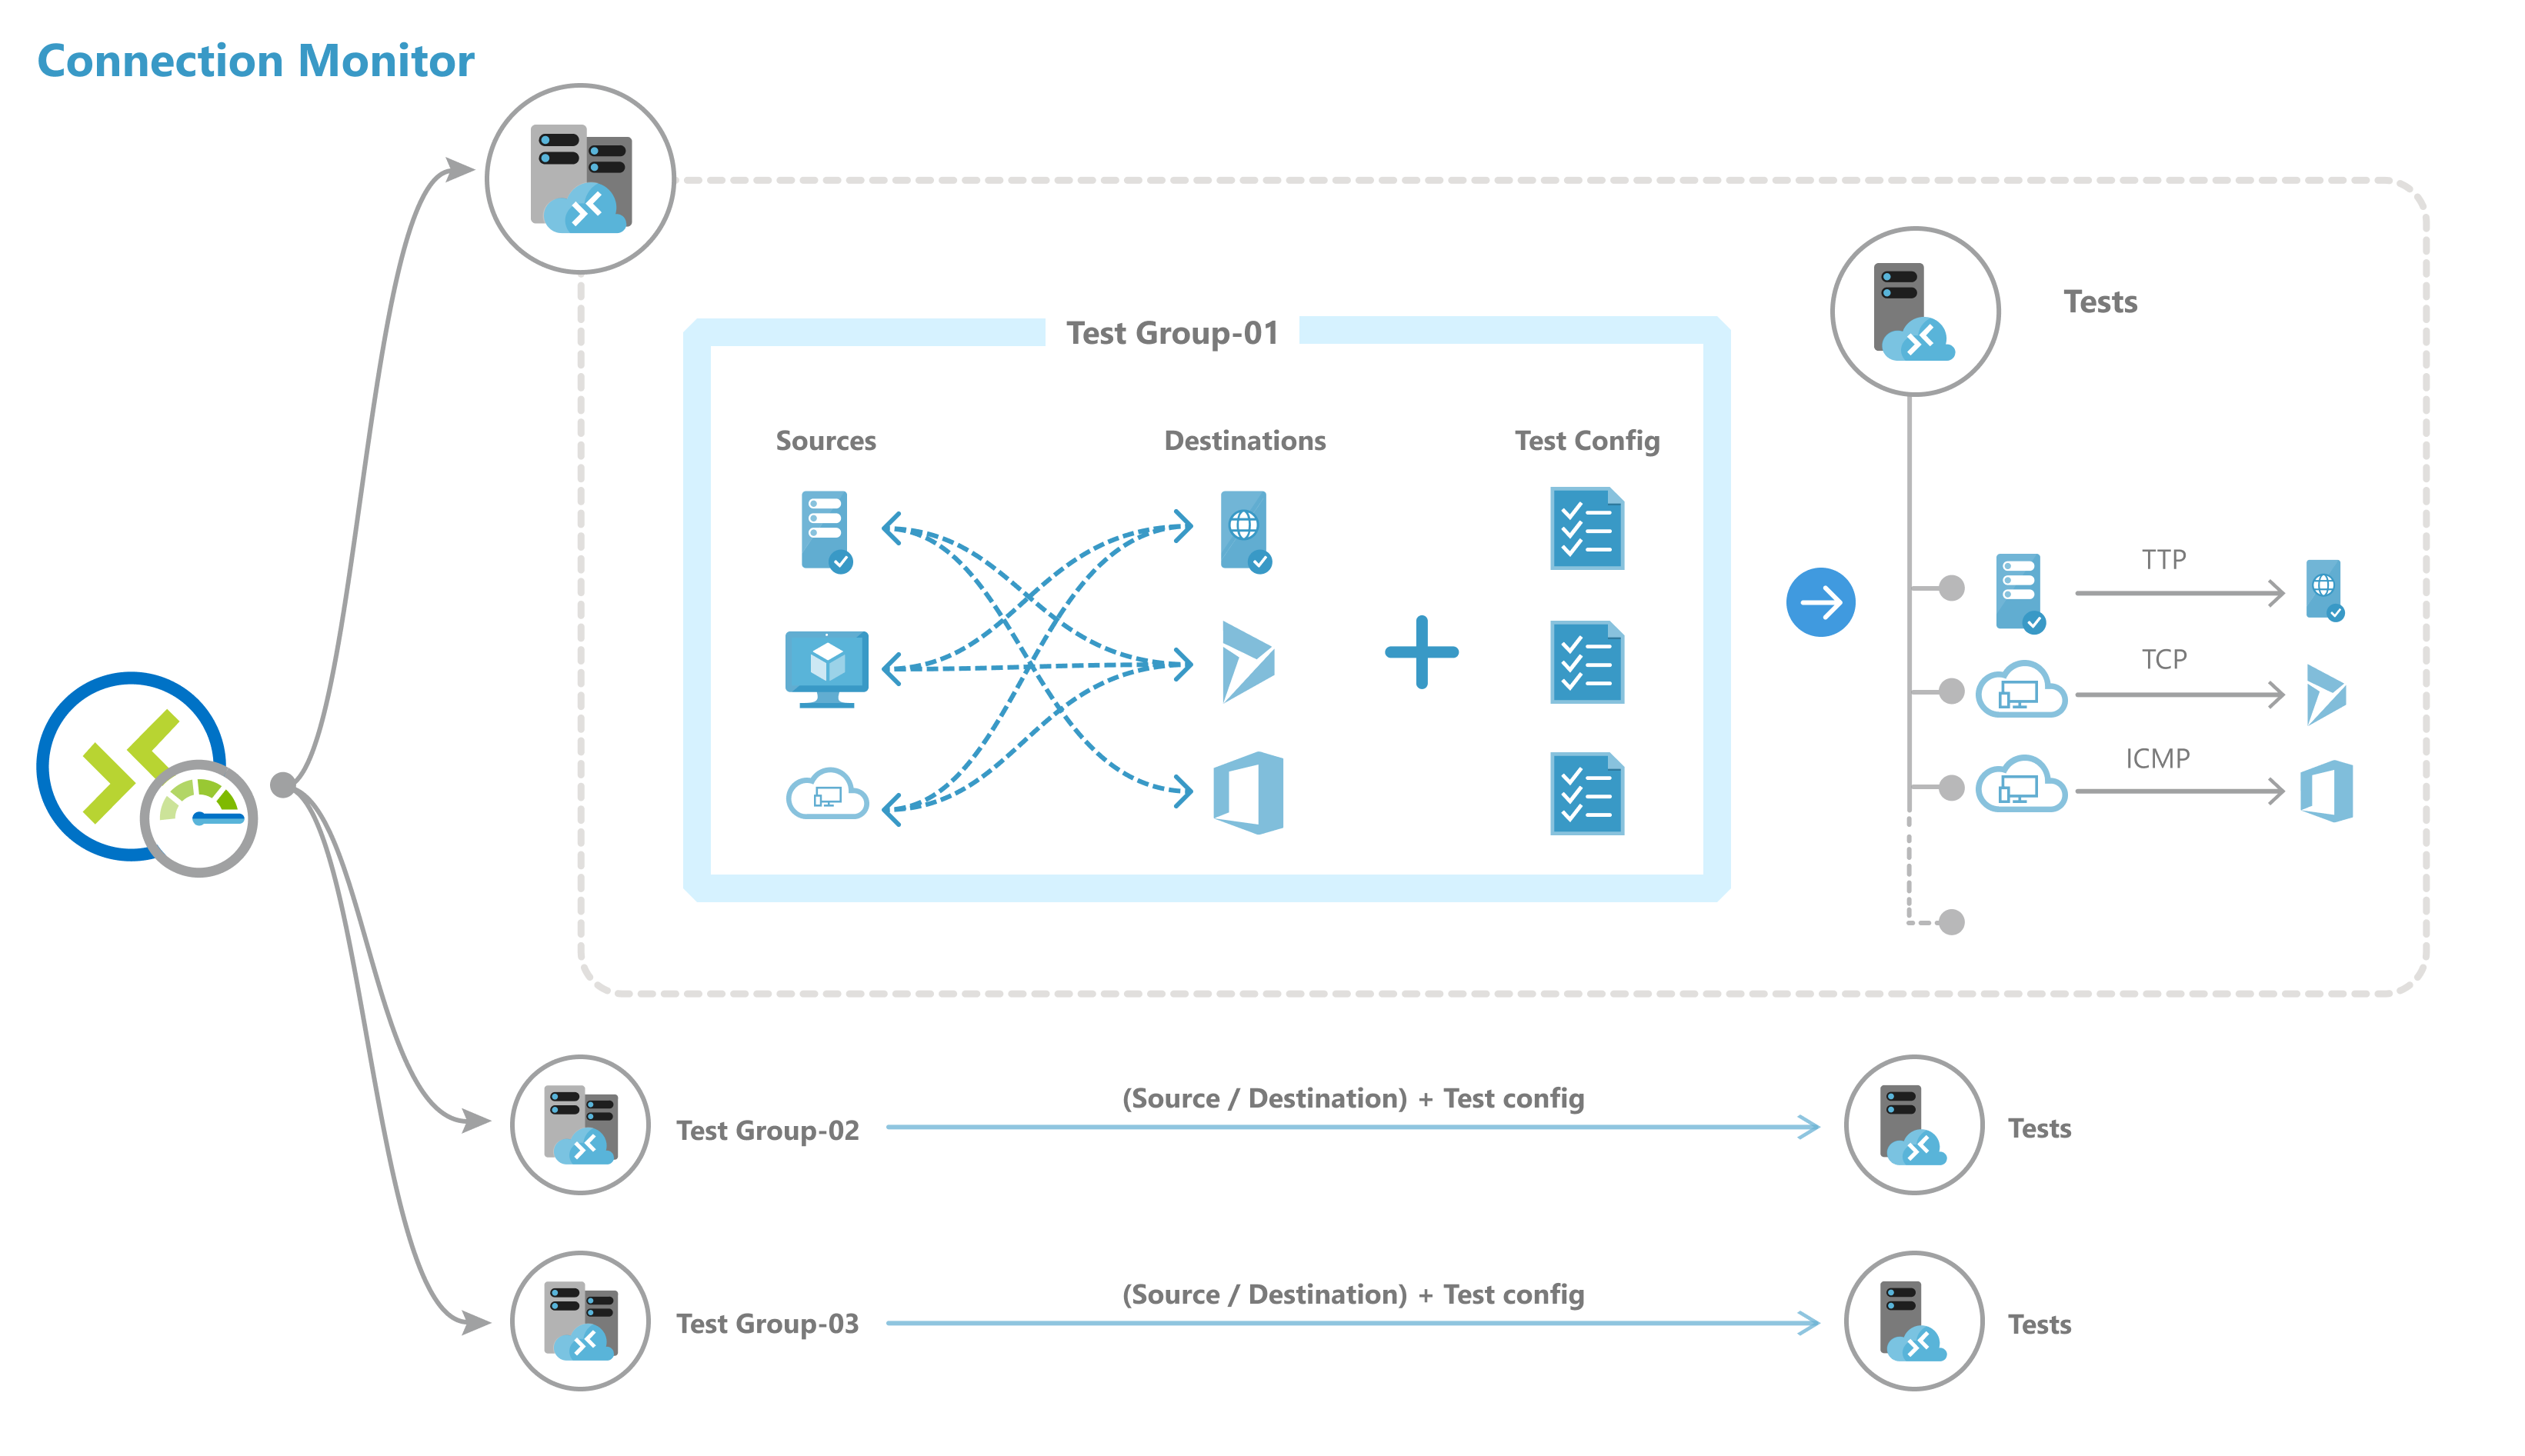
To create a connection monitor, it is required to specify several entities:
- Connection monitor resource: A region-specific Azure resource. All the following entities are properties of a connection monitor resource.
- Endpoint: A source or destination that participates in connectivity checks. Examples of endpoints include Azure VMs, on-premises agents, URLs, and IP addresses.
- Test configuration: A protocol-specific configuration for a test. Based on the protocol you select, you can define the port, thresholds, test frequency, and other properties.
- Test group: The group that contains source endpoints, destination endpoints, and test configurations. A connection monitor can contain more than one test group.
- Test: The combination of a source endpoint, destination endpoint, and test configuration. A test is the most granular level at which monitoring data is available. The monitoring data includes the percentage of checks that failed and the round-trip time (RTT).
Connection Monitor with Azure Bicep
To create a Connection Monitor with Azure Bicep, multiple prerequisites are required:
- Install monitoring agents
Monitoring agents must be installed only on source VMs, whether there are Azure VMs or on-premises machines.
For Azure virtual machines, only the Network Watcher extension for Linux or Windows must be installed.
Azure Bicep code to install Network Watcher extension for Linux on Azure VMs:
param VmName string = 'hubVM'
parm VmLocation string = 'centralindia'

resource VirtualMachineExtensionNetworkWatcherLinux 'Microsoft.Compute/virtualMachines/extensions@2021-04-01' = {
  name: '${VmName}/NetworkWatcherAgentLinux'
  location: VmLocation
  properties:{
    publisher: 'Microsoft.Azure.NetworkWatcher'
    type: 'NetworkWatcherAgentLinux'
    typeHandlerVersion: '1.4'
    autoUpgradeMinorVersion: true
  }
}
Azure Bicep code to install Network Watcher extension for Windows on Azure VMs:
param VmName string = 'hubVM'
parm VmLocation string = 'centralindia'

resource VirtualMachineExtensionNetworkWatcherWindows 'Microsoft.Compute/virtualMachines/extensions@2021-04-01' = {
  name: '${VmName}/NetworkWatcherAgentWindows'
  location: VmLocation
  properties:{
    publisher: 'Microsoft.Azure.NetworkWatcher'
    type: 'NetworkWatcherAgentWindows'
    typeHandlerVersion: '1.4'
    autoUpgradeMinorVersion: true
  }
}
Network Watcher is by default enabled in all subscriptions in Azure. It implies that when virtual networks are created in regions Azure, Network Watcher is automatically created (for each region) in NetworkWatcherRG.
If this default behavior is disabled, it is required to create manually Network Watcher:
Azure Bicep code to create Network Watcher:
param networkMonitoringRgLocation string = 'centralindia'

module networkWatcher 'modules/NetworkWatcher.bicep' = {
  name: 'networkWatcher'
  scope: resourceGroup('NetworkWatcherRG')
  params: {
    networkWatcherName: 'NetworkWatcher_${networkMonitoringRgLocation}'
    location: networkMonitoringRgLocation
  }
}
NetworkWatcher.bicep module content:
param networkWatcherName string
param location string

resource NetworkWatcher 'Microsoft.Network/networkWatchers@2021-05-01' = {
  name: networkWatcherName
  location: location
}
- Create a Connection Monitor - Example
Below code is an Azure Bicep code example to create a Connection Monitor that will:
- Monitor connectivity between hubVM and spoke01 Azure VM on SSH protocol every 30 seconds.
- Monitor connectivity between hubVM and spoke02 Azure VM on SSH protocol every 30 seconds.
- Monitor connectivity between hubVM and onprem VM (using its private IP address instead of Azure Resource Id) on SSH protocol every 30 seconds.
- Monitor connectivity between spoke02VM Azure VM and public URL http://ident.me on HTTP protocol every 30 seconds.
Tip: it is interesting to use URL monitoring to verify that for a given machine, public and/or private DNS resolution works 😁
Azure Bicep code to create a Connection Monitor:
module connectionMonitor 'modules/ConnectionMonitor.bicep' = {
  name: 'connectionMonitor'
  scope: resourceGroup('NetworkWatcherRG')
  params: {
    location: networkMonitoringRgLocation
    networkWatcherName: 'NetworkWatcher_${networkMonitoringRgLocation}'
    connectionMonitorName: 'NetworkMonitoring'
    endpoints: [
      {
        name: 'hubVM'
        type: 'AzureVM'
        resourceId: hubVm.outputs.VirtualMachineId
      }
      {
        name: 'spoke1VM'
        type: 'AzureVM'
        resourceId: spoke01Vm.outputs.VirtualMachineId
      }
      {
        name: 'spoke2VM'
        type: 'AzureVM'
        resourceId: spoke02Vm.outputs.VirtualMachineId
      }
      {
        name: 'onpremVM'
        type: 'ExternalAddress'
        address: onpremVm.outputs.NicPrivateIpAddress
      }
      {
        name: 'ident.me'
        type: 'ExternalAddress'
        address: 'http://ident.me'
      }
    ]
    testConfigurations: [
      {
        name: 'ssh'
        testFrequencySec: 30
        protocol: 'Tcp'
        tcpConfiguration: {
          port: 22
          disableTraceRoute: false
        }
      }
      {
        name: 'http'
        testFrequencySec: 30
        protocol: 'Http'
        httpConfiguration: {
          method: 'Get'
          port: 80
          preferHTTPS: false
          requestHeaders: []
          validStatusCodeRanges: [
            '200'
          ]
        }
      }
    ]
    testGroups: [
      {
        name: 'Monitor_HubVM_to_Spoke1VM__SSH'
        disable: false
        testConfigurations:[
          'ssh'
        ]
        sources: [
          'hubVM'
        ]
        destinations:[
          'spoke1VM'
        ]
      }
      {
        name: 'Monitor_HubVM_to_Spoke2VM__SSH'
        disable: false
        testConfigurations:[
          'ssh'
        ]
        sources: [
          'hubVM'
        ]
        destinations:[
          'spoke2VM'
        ]
      }
      {
        name: 'Monitor_HubVM_to_OnpremVM__SSH'
        disable: false
        testConfigurations:[
          'ssh'
        ]
        sources: [
          'hubVM'
        ]
        destinations:[
          'onpremVM'
        ]
      }
      {
        name: 'Monitor_spoke2VM_to_Ident.me__HTTP'
        disable: false
        testConfigurations:[
          'http'
        ]
        sources: [
          'spoke2VM'
        ]
        destinations:[
          'ident.me'
        ]
      }
    ]
    workspaceResourceId: networkMonitoringLaw.outputs.WorkspaceResourceId
  }
}
ConnectionMonitor.bicep module content:
1
2
3
4
5
6
7
8
9
10
11
12
13
14
15
16
17
18
19
20
21
22
23
24
25
param networkWatcherName string
param connectionMonitorName string
param location string
param endpoints array
param testConfigurations array
param testGroups array
param workspaceResourceId string

resource connectionMonitor 'Microsoft.Network/networkWatchers/connectionMonitors@2021-05-01' = {
  name: '${networkWatcherName}/${connectionMonitorName}'
  location: location
  properties:{
    endpoints: endpoints
    testConfigurations: testConfigurations
    testGroups: testGroups
    outputs:[
      {
        type: 'Workspace'
        workspaceSettings:{
          workspaceResourceId: workspaceResourceId
        }
      }
    ]
  }
}
When previous code is deployed, go to Network Watcher => Connection monitor tab and check status:
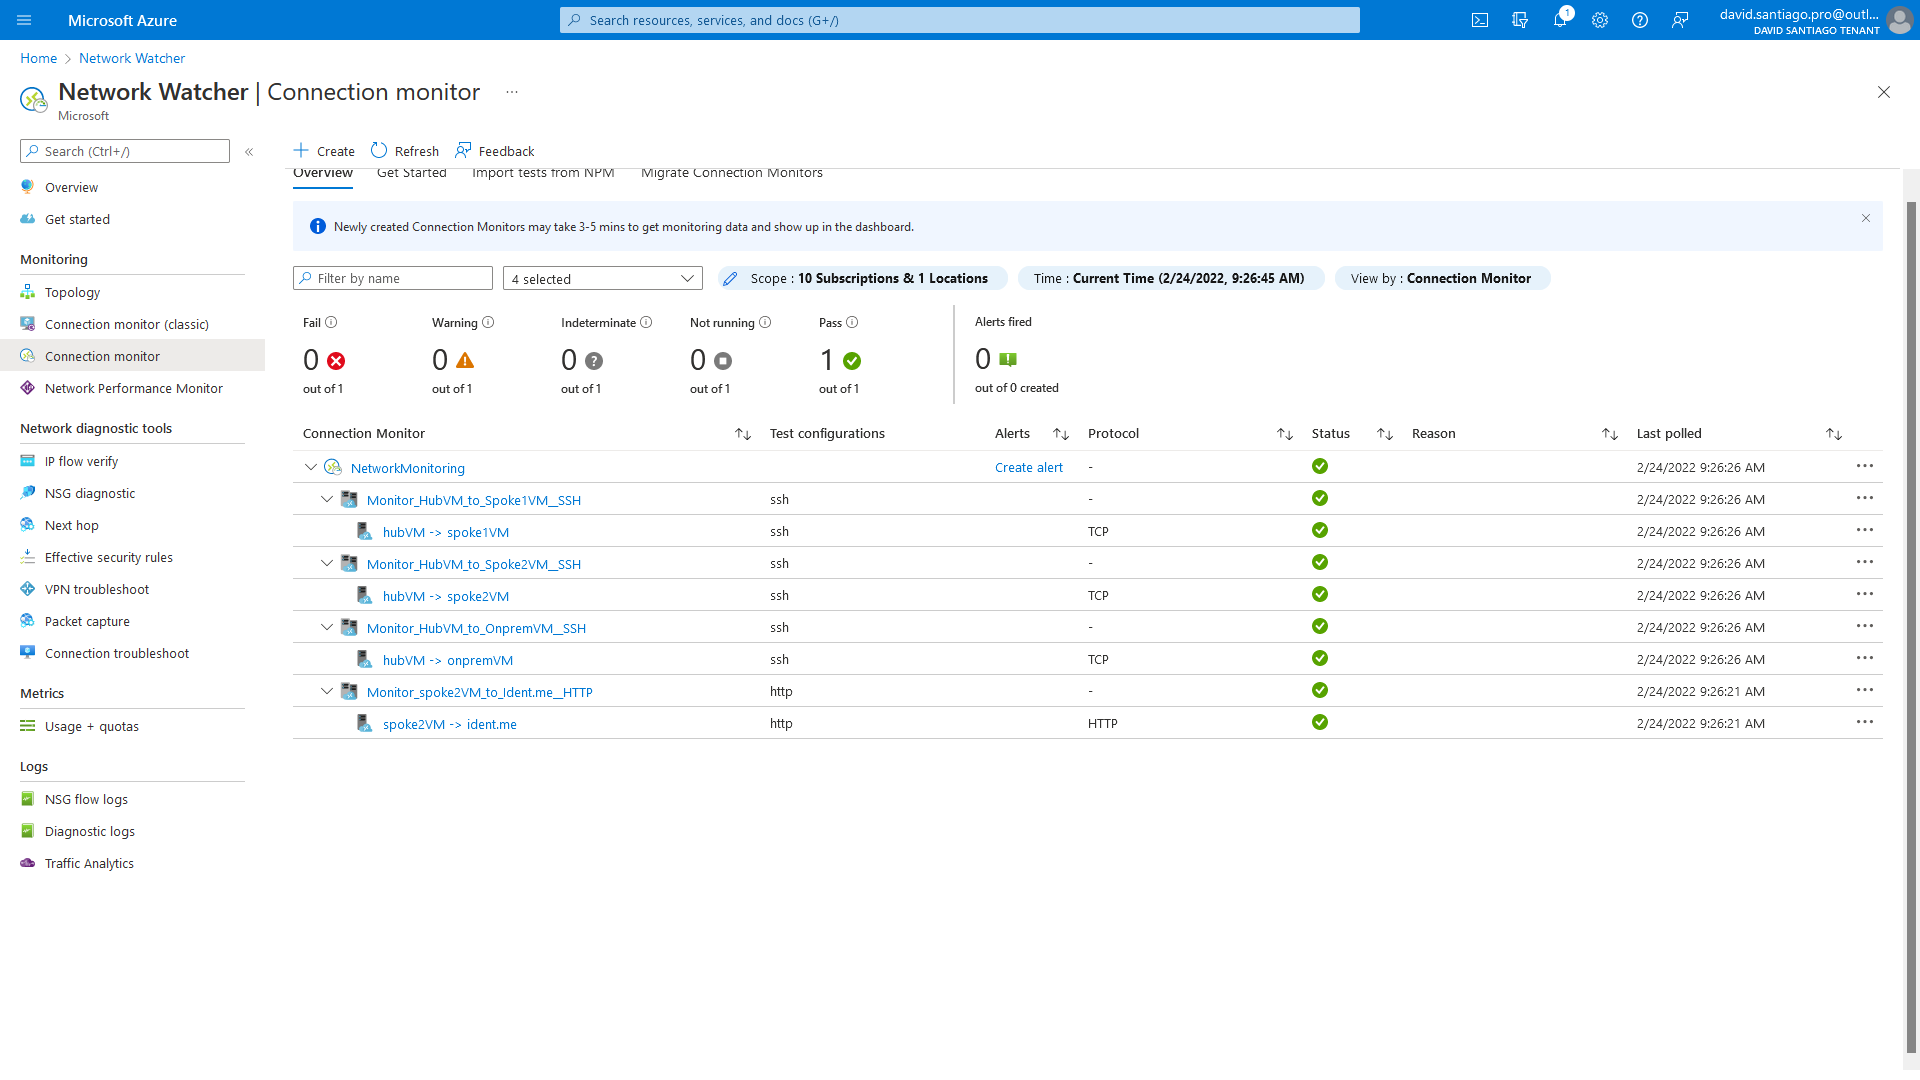
For each test group, Connection Monitor provides two metrics based on tests: check failed (%) and latency round-trip-time (ms).
For critical test groups (example: on-premise <=> Azure), put in place alerting on both metrics is a must-have.
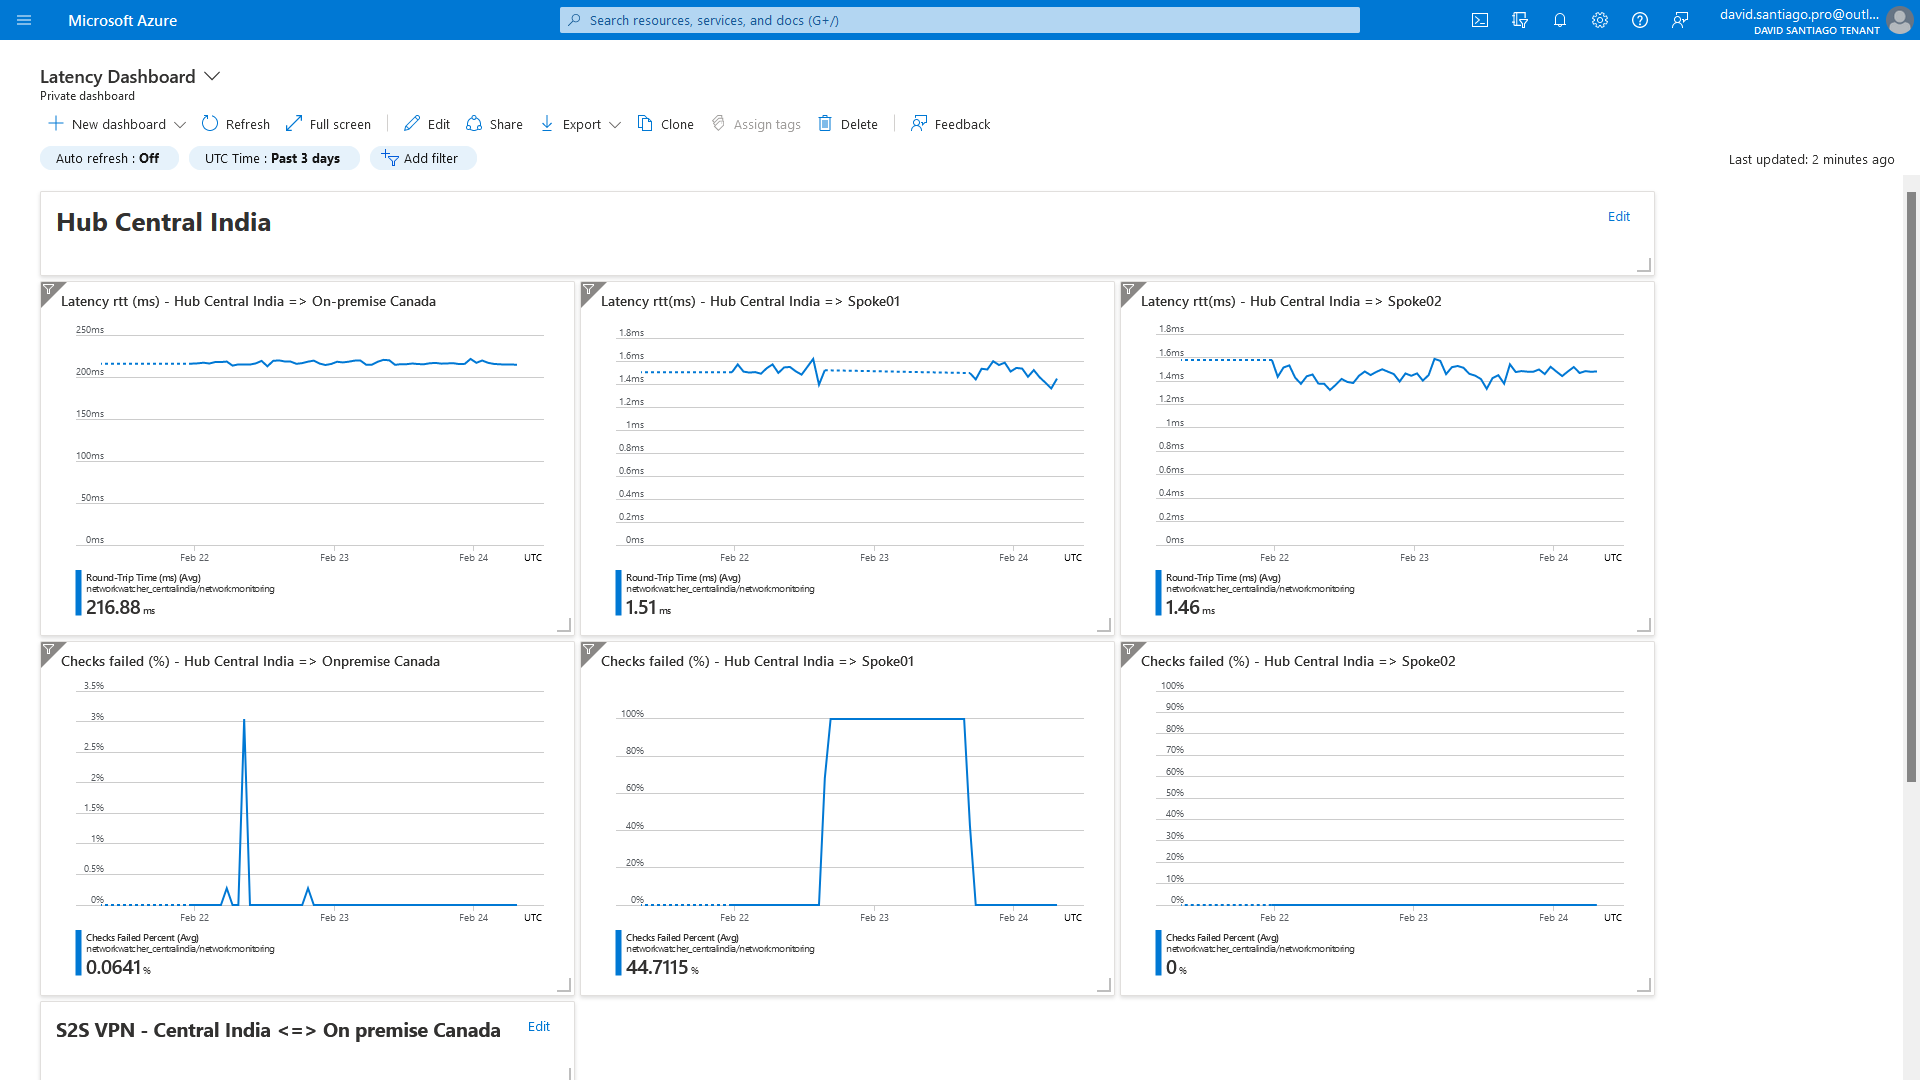
Dashboard
Previous metrics are interesting individually. The tool becomes powerful when you export multiple test groups metrics to a single dashboard.
It is possible to create easily this kind of dashboard, consolidating multiple tests and metrics around the network:
We just need to pin all individual test-group charts to the same Dashboard and organize it as needed.
Lab - Connection Monitor & Bicep
If you want to practice, I create this lab, which quickly creates below infrastructure and set up Connection Monitor from the beginning:
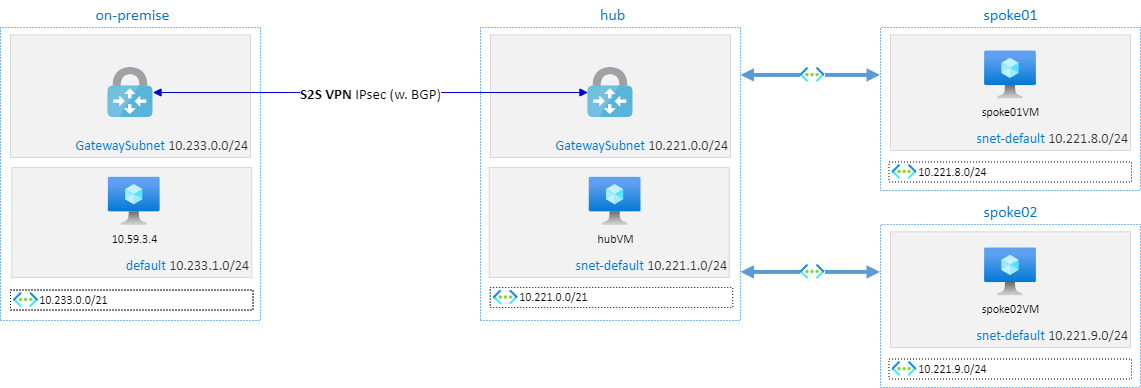
When the infrastructure is deployed, just check connection monitor status and start to create customized dashboards!
Conclusion
Connection Monitor is a simple tool, but so powerful!
I encourage teams using Azure to
- Deploy at least one machine on each remarkable points of the network (each region, each on-premise site…)
- Monitor continuously the network between these remarkable points
- Set up alerts on all critical network pipes
- Create consolidated dashboards for network and operation teams