
Azure Network Insights with Traffic Analytics
This post was originally published on Michelin BlogIT.
Within Michelin, we have connections from several geographic points to Azure regions, through Express Route circuits. An important requirement from our Network and Security teams is the capability to inspect and analyze the network traffic between all our assets. We already had visibility of network traffic between “on-premise” and Azure thanks to our packet capture appliances on these connection points and we had a lack on our Azure environments.
Visualizing network traffic on Azure networks can be a complex task and for a good reason: there is no “on the shelf” systems sniffing this traffic. That is where Azure Network Watcher comes in.
Network Watcher is a regional service that enables monitoring and diagnose conditions at a network level in, to, and from Azure:
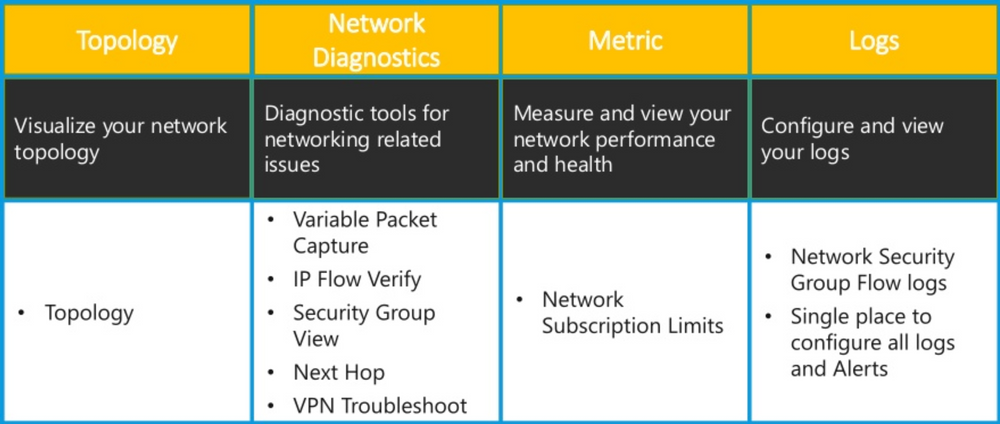
Even if the packet capture feature (in Network Diagnostics) may be interesting locally, that remains a limited functionality: you must specify a source / destination / protocol … which is far from being scalable for our needs. We, therefore had a look to the NSG Flow logs feature of the Network Security Groups (NSG - https://docs.microsoft.com/en-us/azure/virtual-network/security-overview).
NSG Flow Logs
NSG Flow logs is a feature of Azure Network Watcher that allows to log information about IP traffic flowing through an NSG. Flow data is sent to Azure Storage accounts.
NSG Flow logs deposits a .json file in a tree structure :
insights-logs-networksecuritygroupevent/resourceId=/SUBSCRIPTIONS/[ID]/RESOURCEGROUPS/[RESOURCE-GROUP-NAME-FOR-NSG]/PROVIDERS/MICROSOFT.NETWORK/NETWORKSECURITYGROUPS/[NSG NAME]/y=[YEAR]/m=[MONTH/d=[DAY]/h=[HOUR]/m=[MINUTE]/MACADDRESS :`
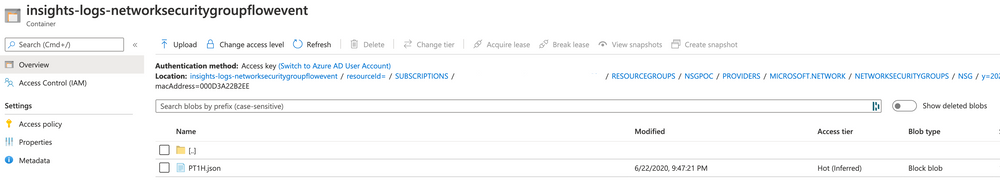
The content of the generated file is not easily digestible by humans whether remains interesting: we can see all the packets circulating over the network and the NSG rules they hit:
1
2
3
4
5
6
7
8
9
10
11
12
13
14
15
16
17
18
19
20
21
22
23
24
25
26
27
28
29
30
31
32
33
34
35
36
37
38
39
40
41
42
43
44
45
46
47
48
49
{
  "records": [
    {
      "time": "2020-06-22T19:00:23.1950200Z",
      "systemId": "1b6f47f3-a170-4e0f-a669-3540f8293db7",
      "macAddress": "000D3A22B2EE",
      "category": "NetworkSecurityGroupFlowEvent",
      "resourceId": "/SUBSCRIPTIONS/__/NSGPOC/PROVIDERS/MICROSOFT.NETWORK/NETWORKSECURITYGROUPS/NSG",
      "operationName": "NetworkSecurityGroupFlowEvents",
      "properties": {
        "Version": 2,
        "flows": [
          {
            "rule": "UserRule_D-OU-ANY",
            "flows": [
              {
                "mac": "000D3A22B2EE",
                "flowTuples": [
                  "1592852362,192.168.10.4,52.114.159.22,51188,443,T,O,D,B,,,,",
                  "1592852364,192.168.10.4,13.69.65.27,51189,443,T,O,D,B,,,,",
                  "1592852409,192.168.10.4,52.114.159.22,51196,443,T,O,D,B,,,,",
                  "1592852410,192.168.10.4,52.114.159.22,51197,443,T,O,D,B,,,,",
                  "1592852415,192.168.10.4,13.69.65.29,51198,443,T,O,D,B,,,,",
                  "1592852415,192.168.10.4,13.69.65.29,51199,443,T,O,D,B,,,,",
                  "1592852418,192.168.10.4,13.69.65.29,51199,443,T,O,D,B,,,,",
                  "1592852418,192.168.10.4,13.69.65.29,51198,443,T,O,D,B,,,,"
                ]
              }
            ]
          },
          {
            "rule": "UserRule_D-IN-ANY",
            "flows": [
              {
                "mac": "000D3A22B2EE",
                "flowTuples": [
                  "1592855020,165.22.143.3,192.168.10.4,56587,32512,T,I,D,B,,,,",
                  "1592855032,107.175.87.152,192.168.10.4,35909,8088,T,I,D,B,,,,",
                  "1592855035,1.188.220.189,192.168.10.4,38003,23,T,I,D,B,,,,",
                  "1592855043,194.26.29.21,192.168.10.4,44022,3304,T,I,D,B,,,,"
                ]
              }
            ]
          }
        ]
      }
    }
  ]
}
This is where Traffic Analytics comes in.
Traffic Analytics
Traffic Analytics processes NSG Flow Log data enabling people to visualize, query, analyze, and understand network traffic. Something much more digestible and human-readable.
It requires to deploy a Log Analytics Workspace and it is configured in the same place as NSG Flow Logs (but it can be done afterward):
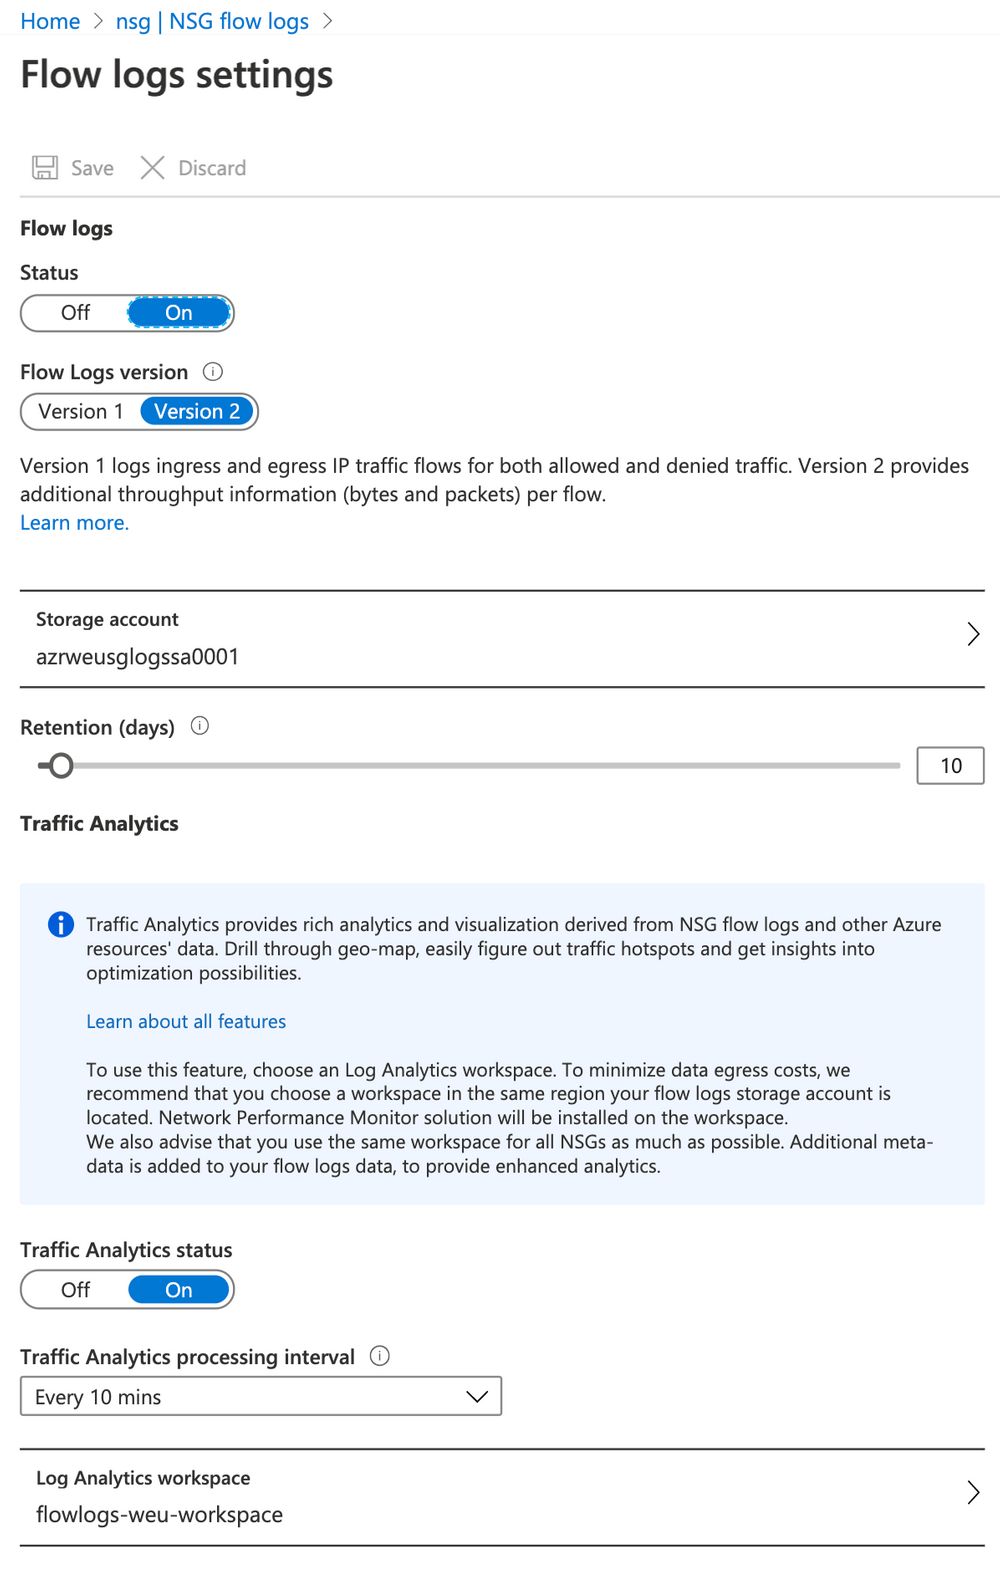
It’s also possible to activate it through Azure CLI:
1
az network watcher flow-log configure -g NSGPOC --enabled true --nsg nsg --storage-account azrweusglogssa0001 --retention 90 --workspace flowlogs-weu-workspace --traffic-analytics true
Once enabled, this allows you to directly request the logs in the Log Analytics Workspace:
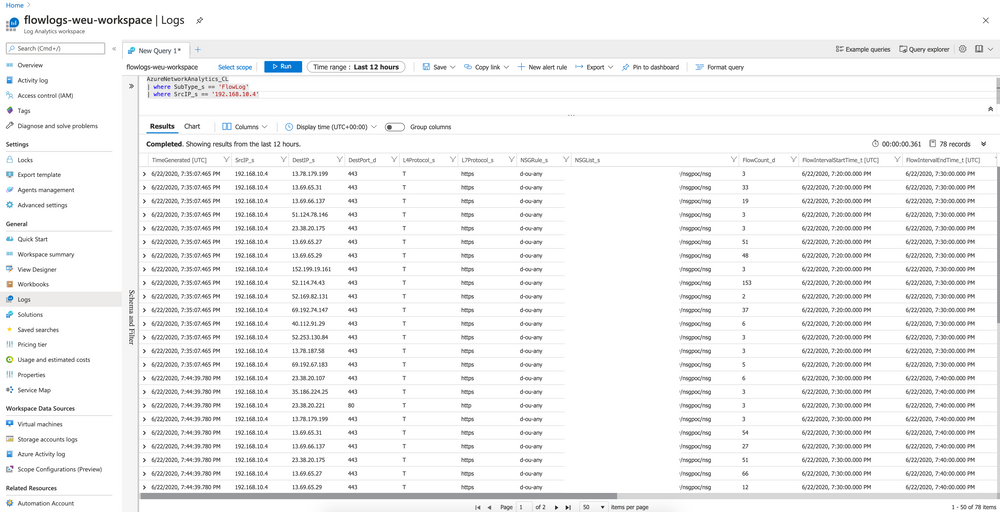
Ok, we have taken a step: we can request the traffic within subnets where the NSG is attached. However, this interface is not user friendly: it takes time to find the right information because it is not very graphic.
Azure Monitor Workbooks
Workbooks provide a flexible canvas for data analysis and the creation of rich visual reports within the Azure portal. They allow you to scrap multiple data sources from across Azure, and combine them into unified interactive experiences.
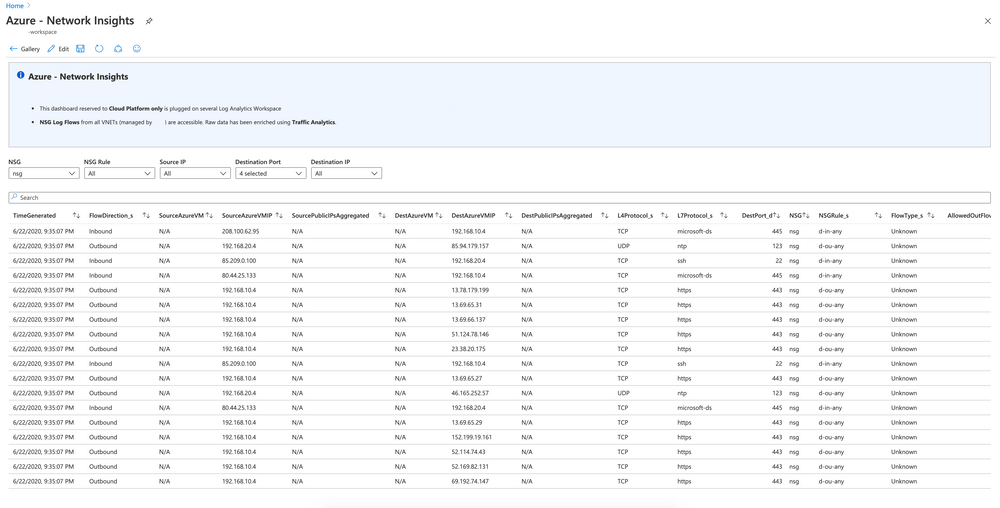
By plugging an Azure Monitor Workbook on the Log Analytics Workspace created for NSG Flow logs feature, we can create dashboards with tables and charts with filters, and then share them. This allows us to troubleshoot faster or learning our network usage.
Dashboard example
Source code of this dashboard is available here.
How to scale ?
The question of scaling up arises when we have assets deployed on several Azure regions (with several subscriptions and virtual networks).
We decided to instantiate one Storage Account and Log Analytics Workspace per Azure region. All the NSG Flow logs for the same region are then plugged into the same StorageAccount-LogAnalyticsWorkspace couple:
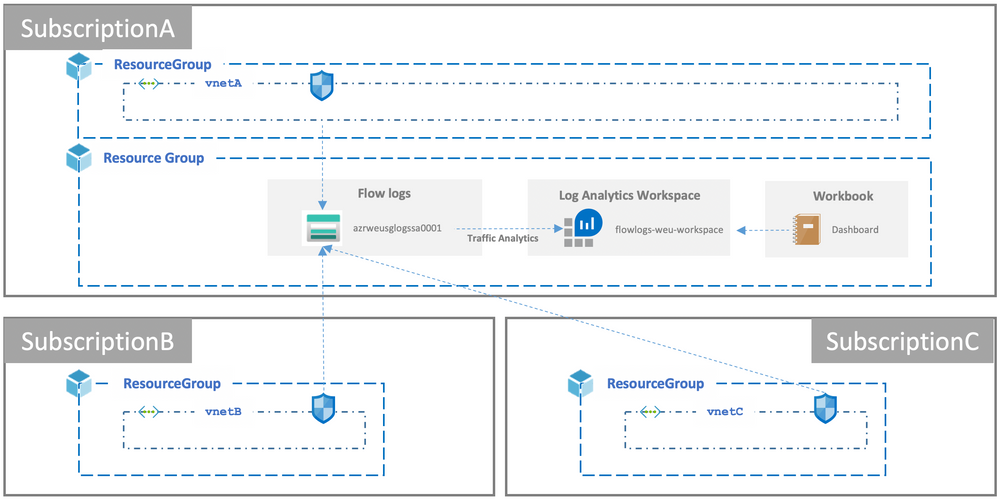
This avoids the egress cost we can have by sending the data to another location.
How to consolidate ?
Finally, it is not necessary to have several Azure Monitor Workbooks: only one may be sufficient because it can be plugged into several Log Analytics Workspace, which facilitates maintenance.
It can be done by Azure Portal or by updating Dashboard source code:
1
2
3
4
5
6
7
8
9
10
11
12
13
{
  "version": "Notebook/1.0",
  "items": [
      ...
  ],
  "defaultResourceIds": [
    // PUT HERE RESOURCE ID(s) of Log Analytics Workspace
  ],
  "fallbackResourceIds": [
    // PUT HERE RESOURCE ID(s) of Log Analytics Workspace
  ],
  "$schema": "https://github.com/Microsoft/Application-Insights-Workbooks/blob/master/schema/workbook.json"
}
It facilitates the maintenance if you want to update the dashboard. However, the display time may be longer depending on the volume.
We hope this article has been useful for your exploration of network data.